logo CBCE Skill INDIA

Welcome to CBCE Skill INDIA. An ISO 9001:2015 Certified Autonomous Body | Best Quality Computer and Skills Training Provider Organization. Established Under Indian Trust Act 1882, Govt. of India. Identity No. - IV-190200628, and registered under NITI Aayog Govt. of India. Identity No. - WB/2023/0344555. Also registered under Ministry of Micro, Small & Medium Enterprises - MSME (Govt. of India). Registration Number - UDYAM-WB-06-0031863

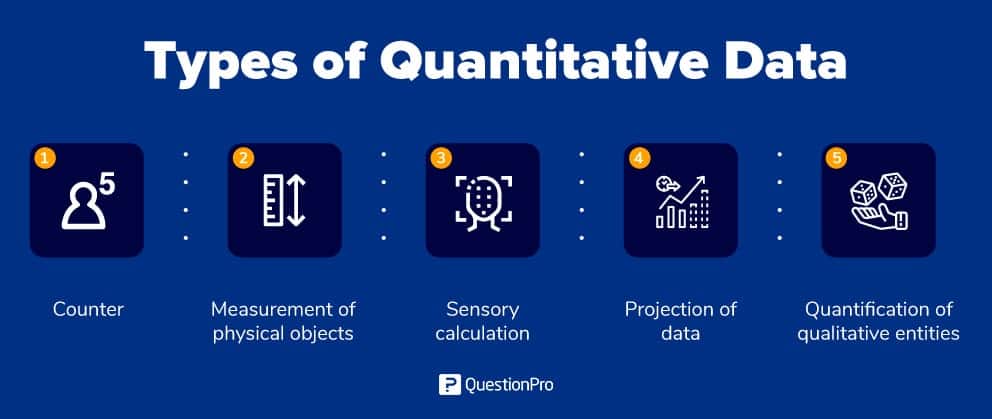
Types of Quantitative Data with Examples!


Types of Quantitative Data with Examples
 

Quantitative data can be categorized into different types based on the measurement scale and characteristics of the data.


Here are the main types of quantitative data with examples:


  1. Nominal Data:

    • Nominal data involves categories or labels that do not have a natural order or ranking.
    • Examples:
      • Gender (e.g., "Male," "Female," "Non-binary")
      • Marital status (e.g., "Single," "Married," "Divorced")
      • Types of fruits (e.g., "Apple," "Banana," "Orange")
  2. Ordinal Data:

    • Ordinal data represents categories or labels with a clear order or ranking but doesn't imply equal intervals between values.
    • Examples:
      • Educational levels (e.g., "High School," "Bachelor's Degree," "Master's Degree")
      • Customer satisfaction ratings (e.g., "Very Dissatisfied," "Dissatisfied," "Neutral," "Satisfied," "Very Satisfied")
      • Performance ratings (e.g., "Poor," "Fair," "Good," "Excellent")
  3. Interval Data:

    • Interval data has ordered categories with equal intervals between values, but it lacks a meaningful zero point.
    • Examples:
      • Temperature in degrees Celsius (e.g., 20°C, 25°C, 30°C)
      • IQ scores (e.g., IQ 100, IQ 120, IQ 140)
      • Calendar years (e.g., 2000, 2010, 2020)
  4. Ratio Data:

    • Ratio data has ordered categories with equal intervals between values, and it has a meaningful zero point, which indicates the absence of the attribute.
    • Examples:
      • Age in years (e.g., 25 years, 40 years, 60 years)
      • Height in centimeters (e.g., 150 cm, 175 cm, 200 cm)
      • Weight in kilograms (e.g., 60 kg, 80 kg, 100 kg)
  5. Count Data:

    • Count data represents whole numbers that count the frequency or occurrences of an event within a specific category.
    • Examples:
      • Number of customer complaints
      • Number of items sold
      • Number of people in a household
  6. Continuous Data:

    • Continuous data can take on an infinite number of values within a range and can be measured with a high level of precision.
    • Examples:
      • Time in seconds (e.g., 10.5 seconds, 15.25 seconds)
      • Blood pressure measurements (e.g., 120/80 mmHg, 130/90 mmHg)
      • Distance in meters (e.g., 1.5 meters, 3.75 meters)
  7. Monetary Data:

    • Monetary data represents currency values, typically in the form of decimals with two decimal places.
    • Examples:
      • Prices of products (e.g., $9.99, $25.50, $199.95)
      • Salaries and wages (e.g., $50,000, $75,000, $100,000)


These are the common types of quantitative data with examples. Depending on the context and measurement scale, you may encounter different subtypes and variations of quantitative data. Understanding the type of quantitative data you are working with is essential for selecting appropriate statistical methods and drawing meaningful conclusions in data analysis and research.


Thank you.

Popular Post:

Give us your feedback!

Your email address will not be published. Required fields are marked *
0 Comments Write Comment