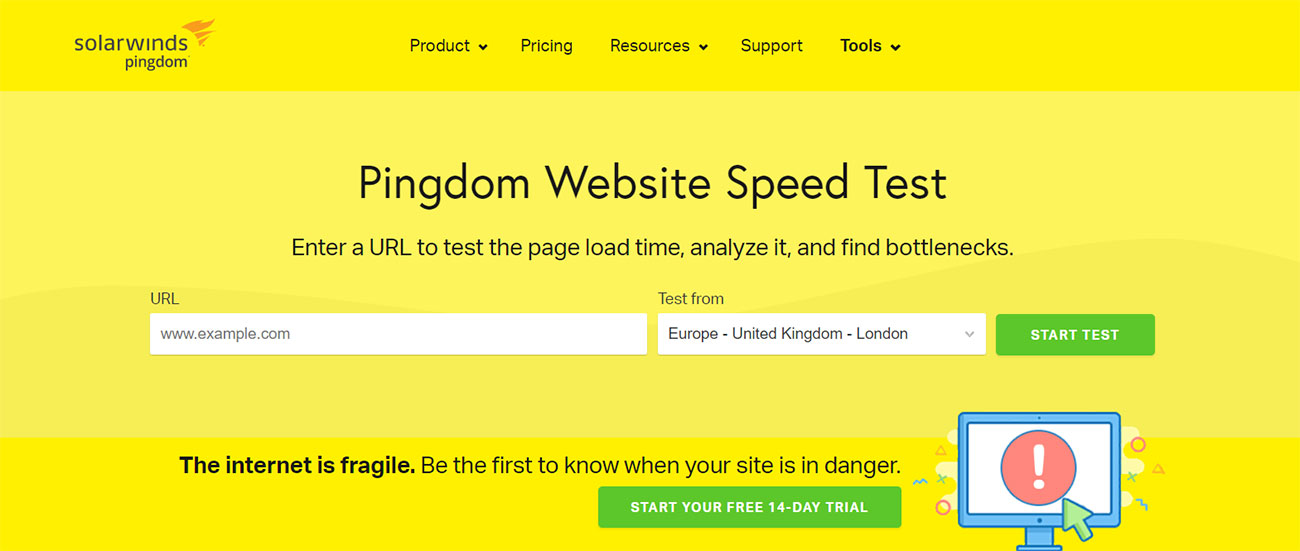
How Pingdom Calculate Load Time
Pingdom calculates website load time by measuring the time it takes for a web page to load completely. The load time is a critical metric for assessing the performance and user experience of a website. Here's how Pingdom calculates load time:
1. DNS Resolution:
- The process begins with DNS resolution, where Pingdom looks up the domain's IP address. The time taken for this DNS resolution is included in the overall load time.
2. Connect Time:
- After obtaining the IP address, Pingdom establishes a connection to the web server. The time taken to establish this connection is known as the connect time.
3. SSL/TLS Handshake (if applicable):
- If the website uses HTTPS, there is an additional step known as the SSL/TLS handshake. This involves the negotiation of a secure connection. The time taken for the SSL/TLS handshake is included in the load time.
4. Time to First Byte (TTFB):
- TTFB measures the time it takes for the web server to send the first byte of data in response to the user's request. It includes the time spent processing the request on the server side.
5. Content Download:
- After receiving the first byte, Pingdom measures the time it takes to download the entire content of the web page, including HTML, images, CSS, JavaScript, and other assets.
6. Document Complete Time:
- Document complete time is the moment when the browser signals that it has finished loading the main content of the page. It includes the time to download and render all primary resources.
7. Fully Loaded Time:
- Fully loaded time represents the point when all page resources, including images, scripts, and other elements, have completed loading. This metric provides a comprehensive view of the overall page load performance.
8. Page Size and Number of Requests:
- Pingdom also provides information about the total size of the web page and the number of requests made to load all resources. These metrics can help identify opportunities for optimization.
9. Waterfall Chart:
- Pingdom presents the load time information in a waterfall chart. The waterfall chart visually represents the sequence and timing of each resource loaded during the page load process.
Factors Affecting Load Time:
-
Network Latency: The physical distance between the user and the server can impact load time.
-
Server Performance: The speed and efficiency of the web server in processing and delivering content influence load time.
-
Optimization: The size and complexity of web page resources, as well as the use of optimization techniques (caching, compression, etc.), play a role.
-
Content Delivery Network (CDN): The use of a CDN can reduce latency by serving content from servers located closer to the user.
-
Browser Rendering: The efficiency of the user's web browser in rendering the page affects load time.
By analyzing these components, Pingdom provides insights into the performance of a website and helps identify areas for improvement to enhance user experience. Users can leverage this information to optimize their websites for faster load times.
Thank you.